. . . the making of XC FS racing machine - STEREO . . .
Here is some data gathered from Linkage's simulation of three frames: Specialized Epic, Scott Genius and Trek Fuel. These three frames are among the best FS XC frames there are. They have had very many excellent reviews from different magazines and form hundreds of riders throughout the wolrd. As well have these frames been ridden to podium places in World Cup cross country races and in different marathons.
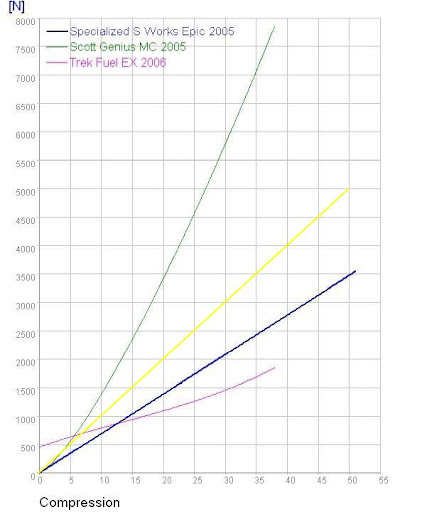
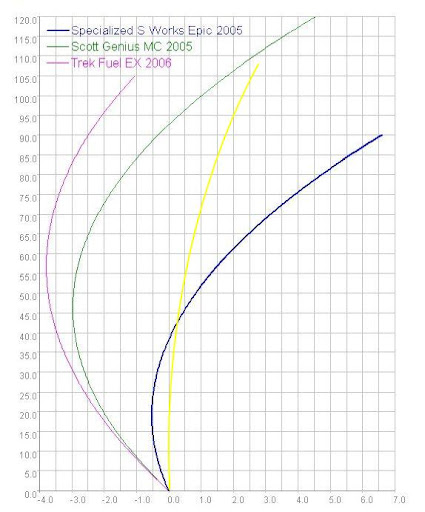
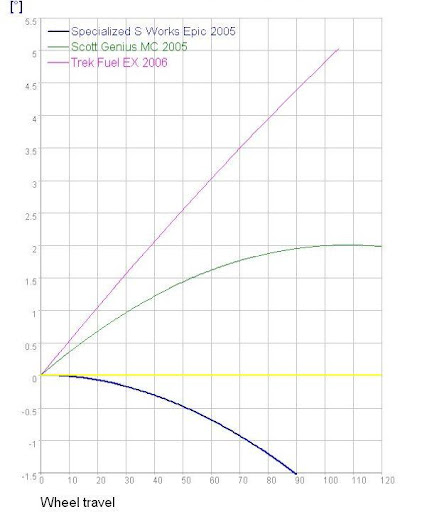
NB! The yellow lines show the "perfect" suspension design!
First is the geometry diagram. This shows the relationship between the actual rear wheel travel and the shock compression. Thick line shows the how much the rear schock compresses with the vertical travel of the rear wheel. Thin line (gradient) shows the progressivity of the travel.

Chain growth. This shows the change in the chain length throughout the travel.

Forces. The Linkage calculates the realtion between vertical forces acting to the rear wheel and the shock compression that it causes. The gradient of this shows the real progressivity of the suspension. The characteristics of a shock paly a big roll here.

Skock curve. This graph shows by how much force the shock reacts to compressing it.

Magnified axle path. This shows how the rear wheel moves through the travel in a coordinate system.

Pedal-kickback. This shows the pedal kickback. It is dependant on the chain growth.
NB! The yellow lines show the "perfect" suspension design!
First is the geometry diagram. This shows the relationship between the actual rear wheel travel and the shock compression. Thick line shows the how much the rear schock compresses with the vertical travel of the rear wheel. Thin line (gradient) shows the progressivity of the travel.

Chain growth. This shows the change in the chain length throughout the travel.

Forces. The Linkage calculates the realtion between vertical forces acting to the rear wheel and the shock compression that it causes. The gradient of this shows the real progressivity of the suspension. The characteristics of a shock paly a big roll here.

Skock curve. This graph shows by how much force the shock reacts to compressing it.

Magnified axle path. This shows how the rear wheel moves through the travel in a coordinate system.

Pedal-kickback. This shows the pedal kickback. It is dependant on the chain growth.


0 Responses to “ANALYZING DATA”
Leave a Reply